1) Go to Uptime Dashboard.
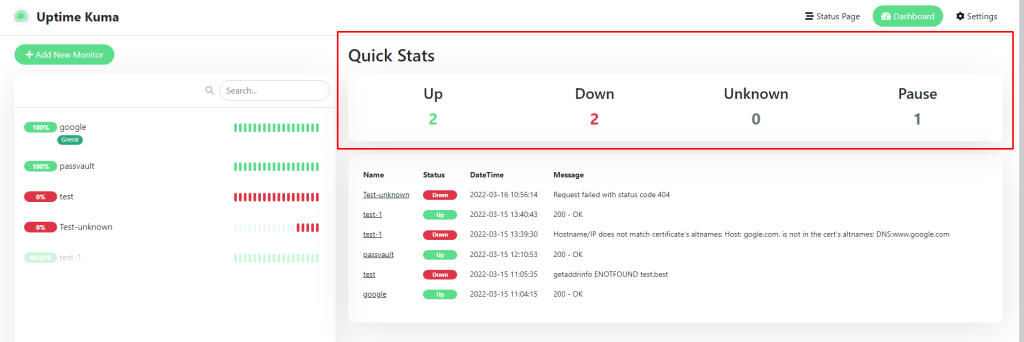
Here you can see the
Up: for show website is doing well
Down: for show website is down not running
Unknown: for website is getting some error from status code.
Pause: for show website is pause for monitoring.
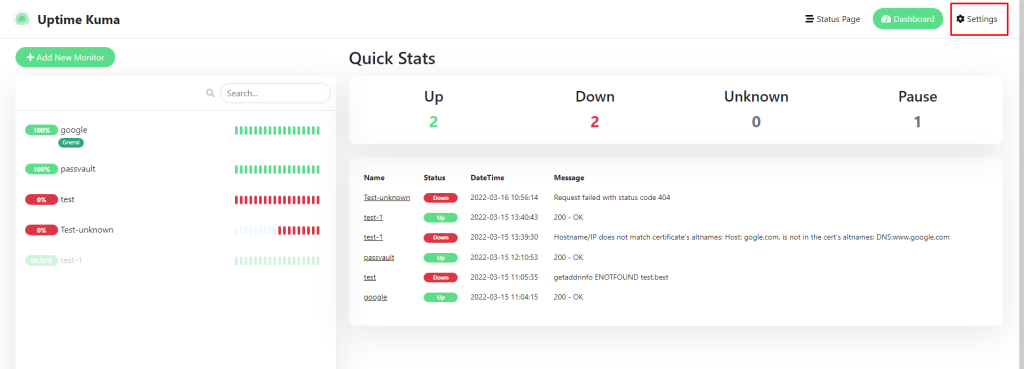
2)Now Click on setting button
3) General setting
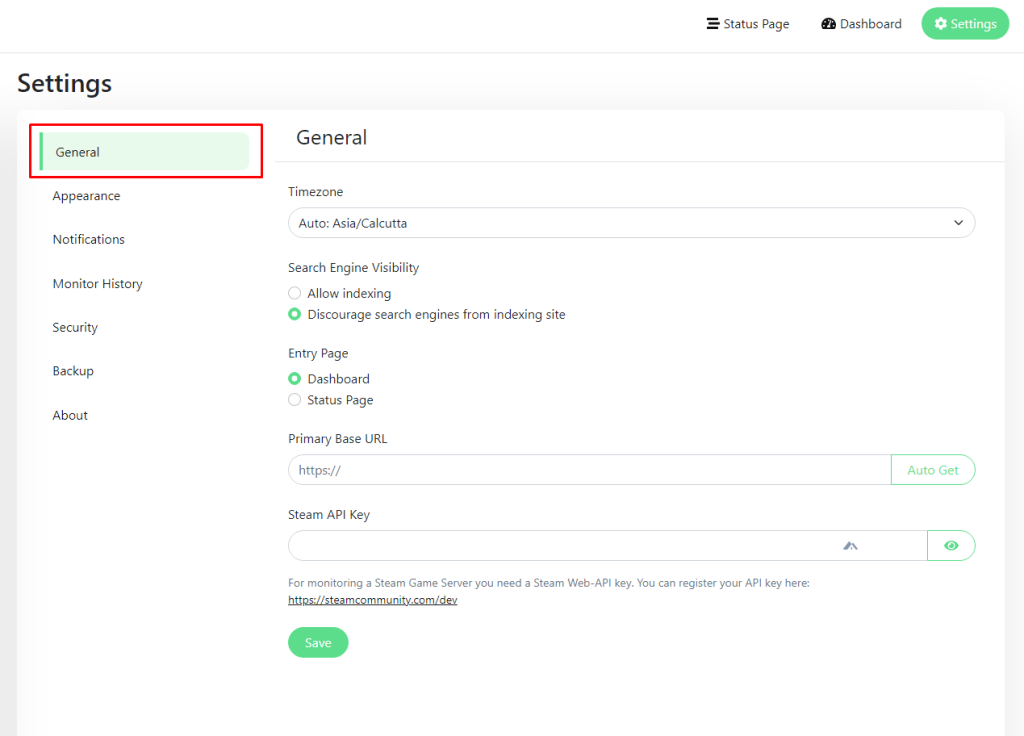
Here you can change Timezone, Search engine..
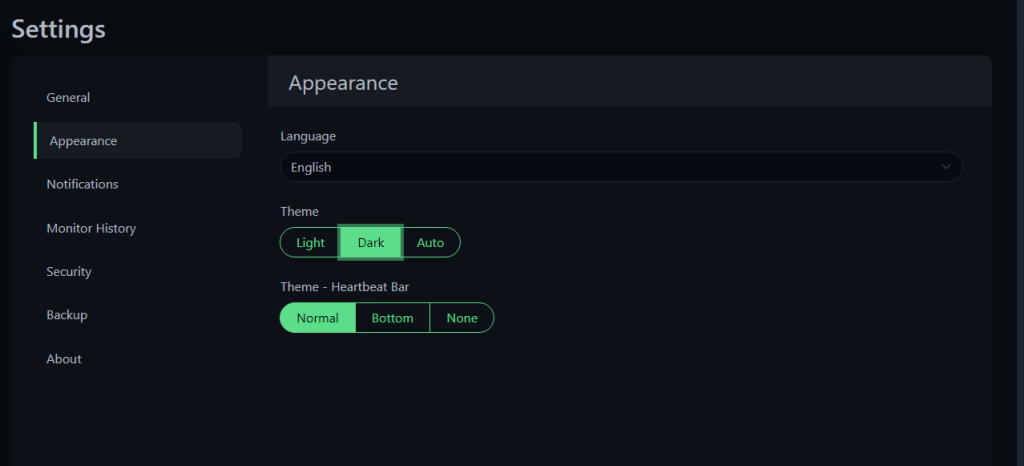
4) Appearance:
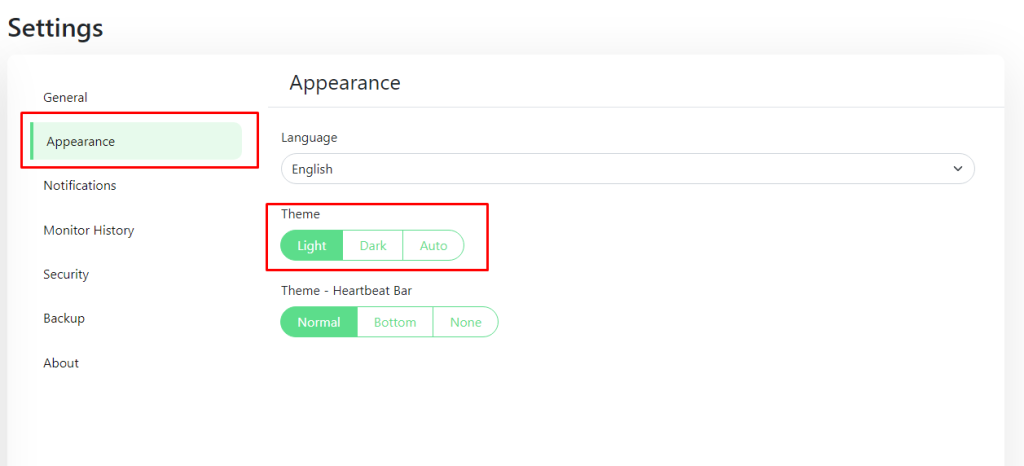
Now click on Theme dark button to experience a dark theme in uptime dashboard.
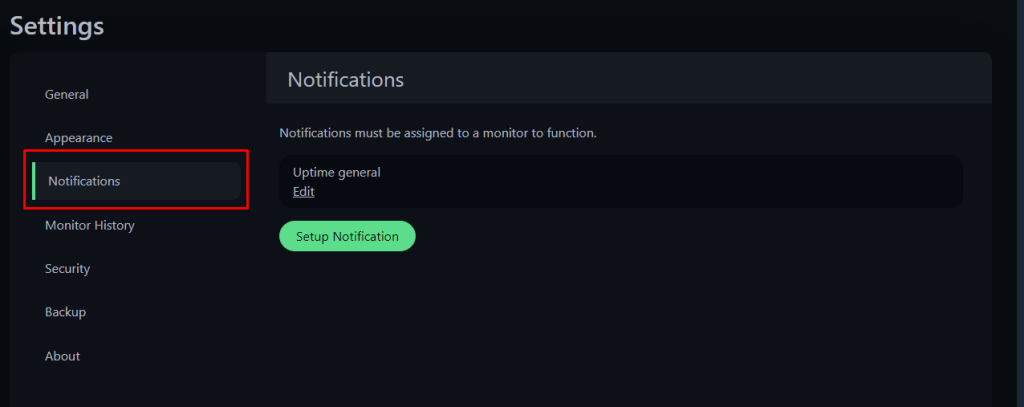
5) Notification: here you can setup the notification for monitor.
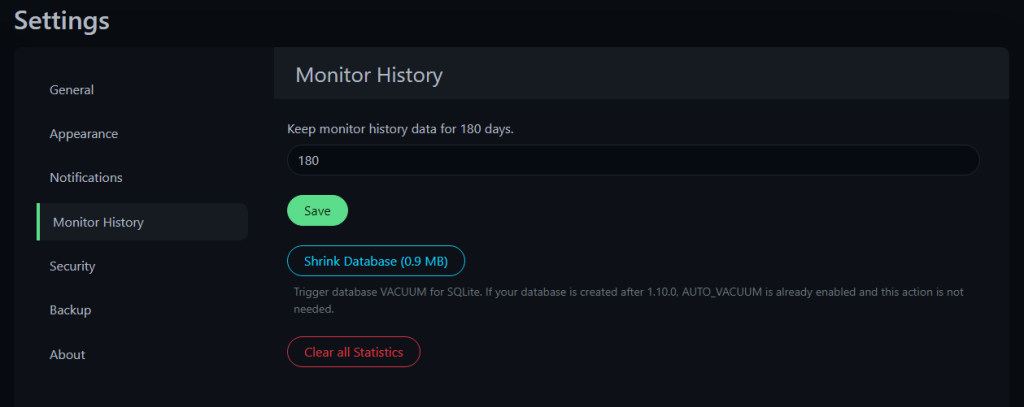
6) Monitor History: here you keep monitor history data for 180days or you can change it also as per requirement. Also shrink database option is there.
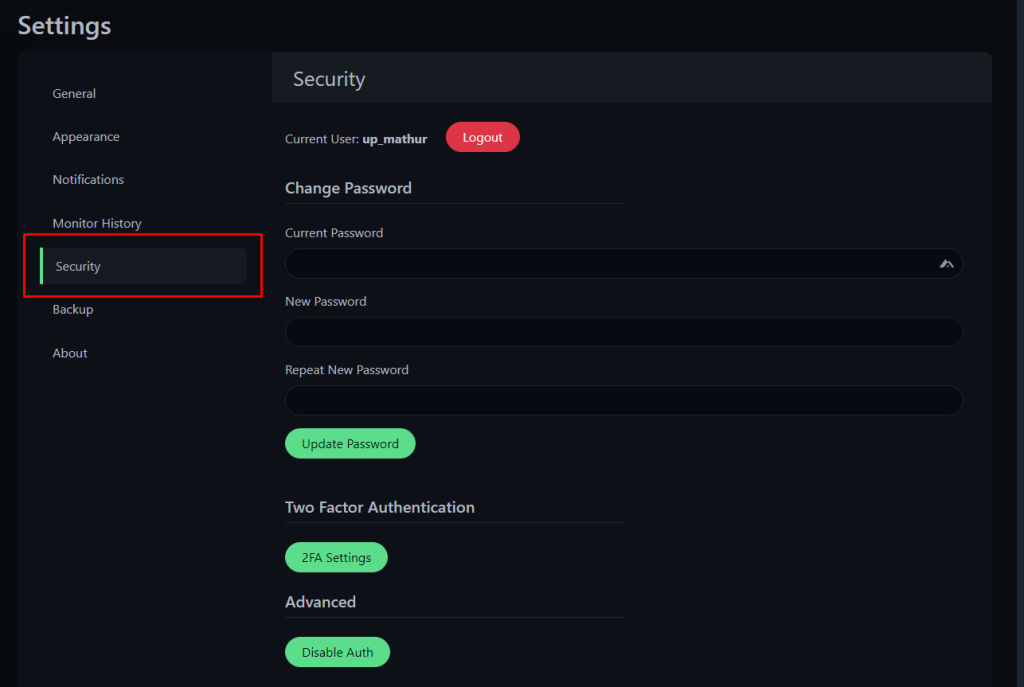
7) Security: In security you can change the password, 2-step authentication setting and Advanced Disable Auth. Option is also there.
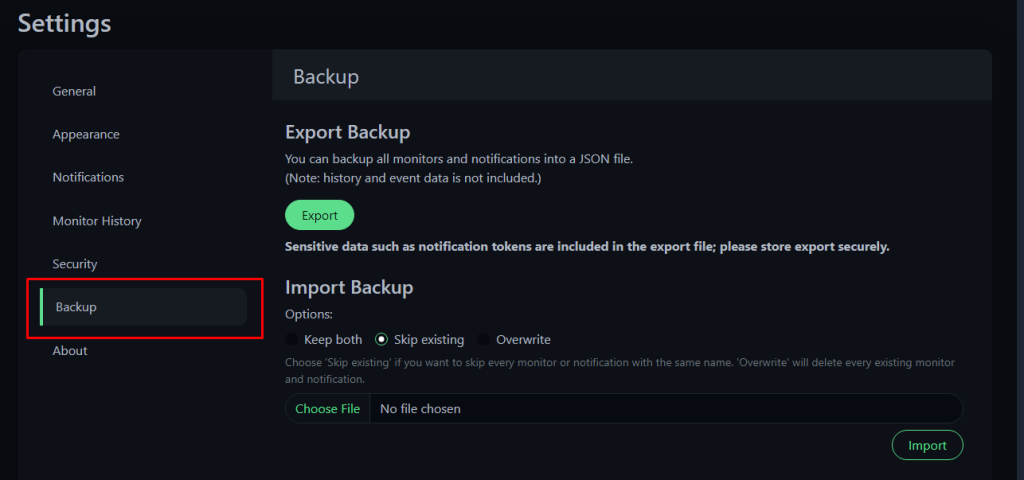
8) Backup: here you can export and import the backup of file.
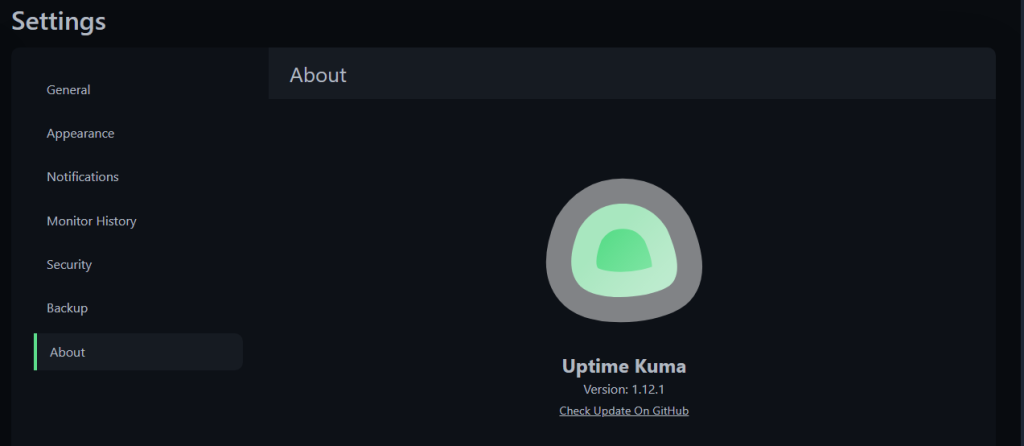
9) About: here you can check the version and also check the any update on GitHub.